Verdict series · Episode 01 · 2026-08-19
SuperTrend, as commonly traded.
SuperTrend's celebrated Bitcoin track record does not survive testing. Its equity path was one lucky ordering of trades. It lost money the one year that mattered. And a quarter of randomly shuffled histories, with all structure destroyed, beat it. The returns are bull-market drift, not timing skill. This is an evaluation of historical behavior, not a prediction, and that honesty is the product.
What we tested
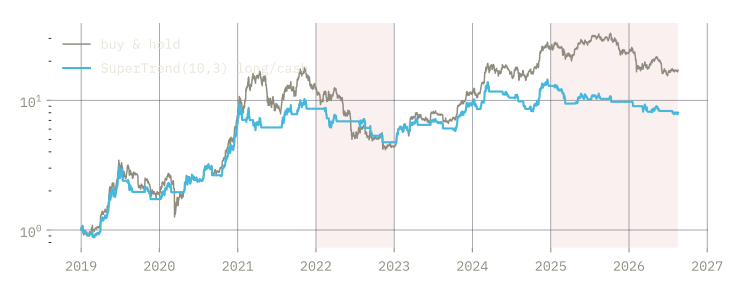
The TradingView built-in SuperTrend (hl2 basis, Wilder ATR), default parameters, traded the way it is commonly traded: long when the trend flips up, cash otherwise, signal on the confirmed close, position from the next bar. Before any testing, the Python engine was proven against TradingView's own execution on identical bars: zero position disagreements across 2,787 bars, equity agreement to fifteen decimal places. Every number below runs on an engine that is exactly the public script.
The baseline already tells the story
Kill one: the path was luck
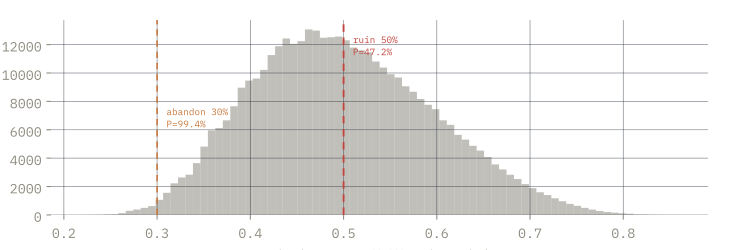
Reorder the same 34 trades 400,000 times and read the drawdown distribution. 47.2% of orderings cut the account in half (the swing-class ruin depth). 99.4% breached the 30% abandonment depth, the point where a rational operator quits the system. The one historical path everyone backtests was among the gentlest available arrangements of its own trades.
Kill two: the bear year
One continuous run, sliced at year boundaries. 2022, the only sustained bear in the window, comes out at Calmar −0.98. The 2025–2026 slice is negative too. A trend strategy that only earns in bull years is a bull-market position with extra steps and a fee bill.
Kill three: noise beats it
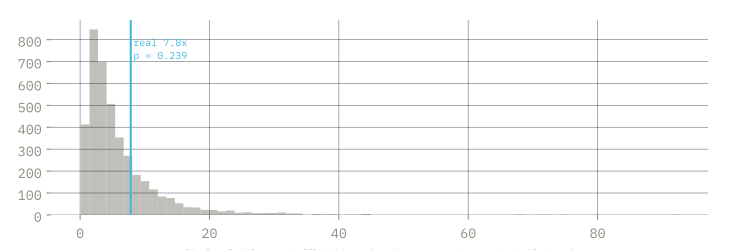
Re-run the strategy on 15,000 shuffled histories: identical returns, volatility preserved, temporal structure destroyed. If SuperTrend's timing added information, the real result should sit far in the right tail. It sits at p = 0.239. About a quarter of structureless noise beat the real run. The seed is disclosed; shuffle it yourself.
The twist: you cannot tune your way out
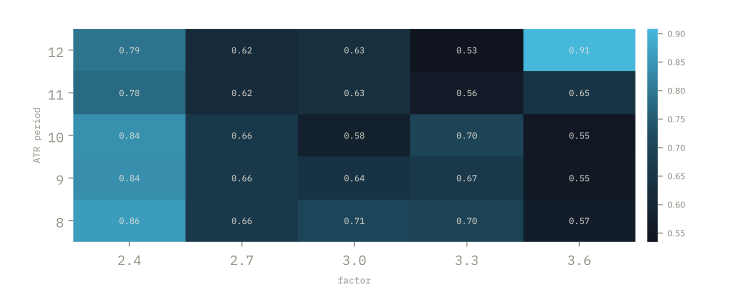
The parameter neighborhood is green everywhere: 100% of the ±20% grid is profitable, and the center is not a lucky peak (sharpness 0.87). This is the most useful finding in the episode: the settings were never the problem. Every parameterization captures bull drift, and none of them beats holding. The edge is absent, not mis-tuned.
What this verdict does not say
- 34 trades is a thin bootstrap sample: 17 per parameter, yellow by our own bands.
- Drawdowns in the bootstrap are measured at trade granularity; bar-level drawdowns run deeper.
- The verdict is scoped to BTCUSDT daily. Other markets and timeframes were not tested here and may differ.
- The component question is separate from the strategy verdict: the latched trend vote showed no parameter luck at all. Dead as a standalone trigger, possibly alive as one vote in a diversified basket. That is a testable claim, and it is the next episode.
Run it on your own chart
The episode ships with a free TradingView tool: SuperTrend Reality Check draws this exact comparison, cost-applied strategy equity vs buy & hold with no repainting and honest numbers, on any symbol you open. Publication pending on TradingView · @Outsample.
Battery: baseline → 400,000-path trade bootstrap → year-slice walk-forward → ±10/20% parameter jitter → 15,000-run permutation, add-one smoothed p, seed 20260819. Verdicts are deterministic under bands v1. Research and education, not financial advice; no result shown implies future performance.